Calibration · temperatureSubscription
Temperature calibration sheet: points, readings and field sheet in PDF
Prepare the data collection of a temperature calibration: range, points, repetitions and direction. Take the blank sheet to the field or record the readings on the device, with the means and the I − P difference of each point, and export the sheet as an unbranded A4 PDF.
Subscription tool
Read the explanation and the example freely. To use the tool with your own data, log in to an account with active access or subscribe.
Read the explanation and the example freely. To use the tool with your own data, log in to an account with active access.
Want to check the quality first? Free, no sign-up: 4–20 mA calculator · residential cable sizing (whole house)
 Enlarge
Where it helps at work
- Calibrate transmitters, indicators and thermometers by comparison in a bath or dry block.
- Prepare the shutdown sheet with the right points before going to the field.
- Record before and after the adjustment in the same sheet, with the error of each point side by side.
- Convert in the sheet itself the reference reading in Ω (Pt100) or mV (thermocouple), or the signal in mA.
- Standardize data collection between technicians and shifts.
What you enter
What you get
Worked example: PT100 transmitter in a dry block
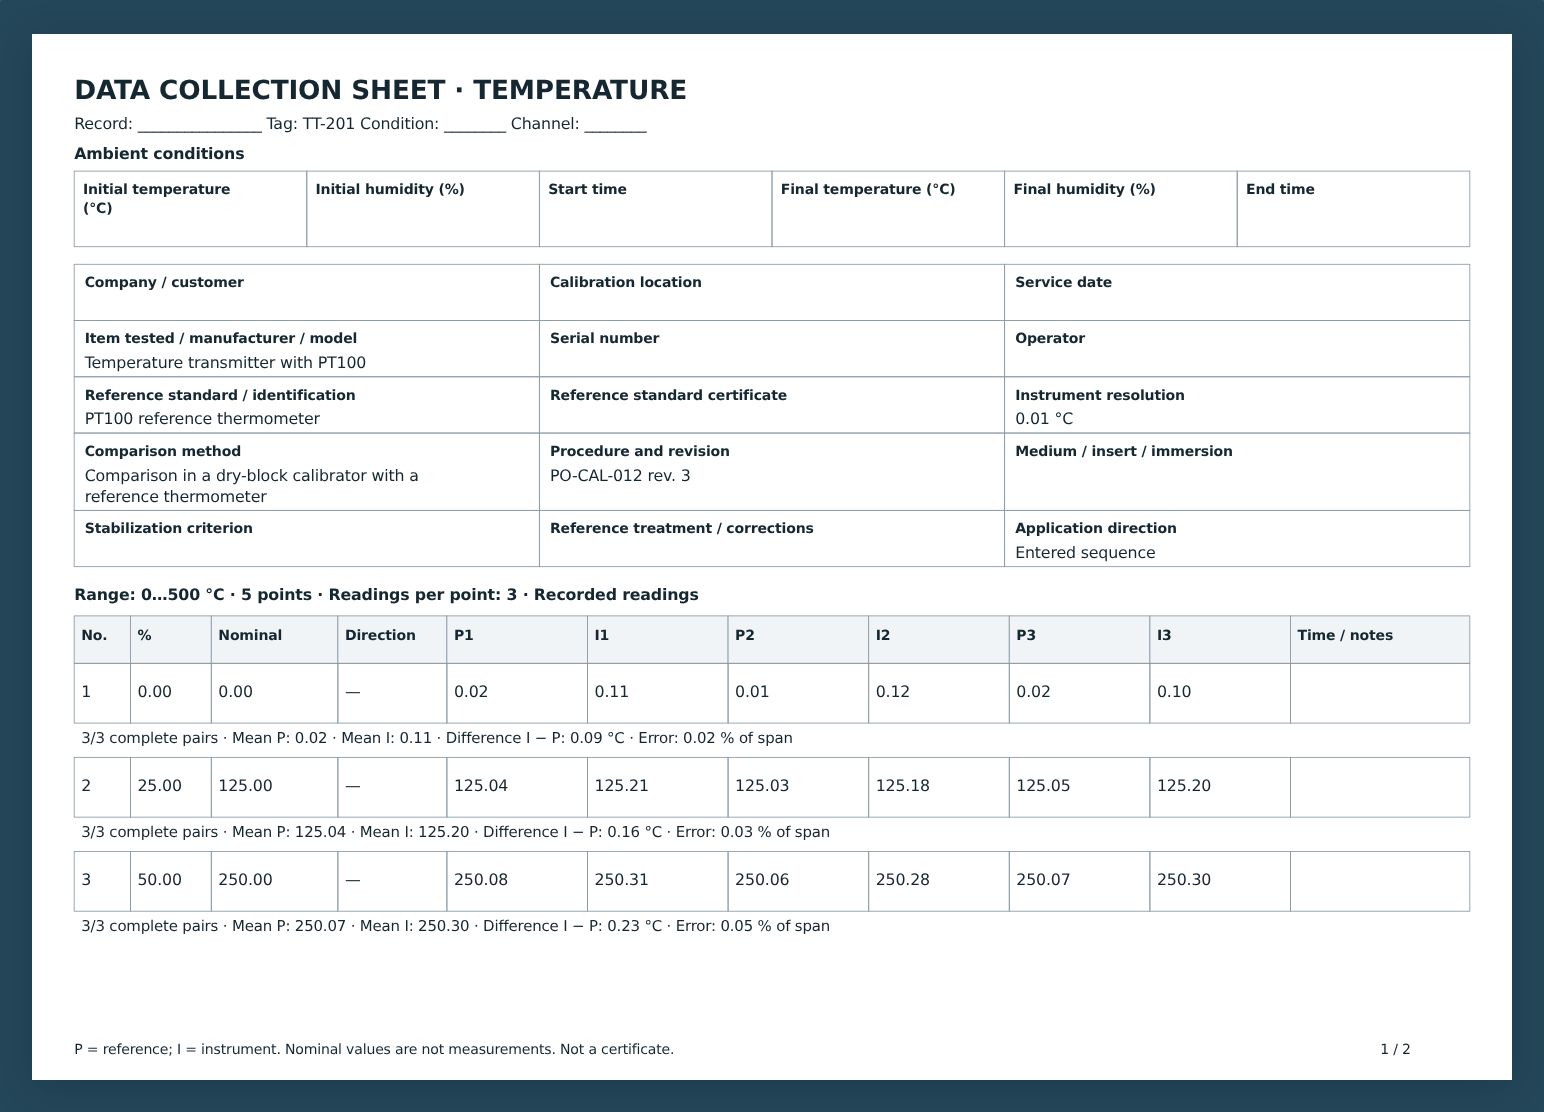
A temperature transmitter with a PT100, range 0 to 500 °C, is compared with a reference thermometer in a dry-block calibrator. The sheet was prepared with 5 points, including both ends, and 3 readings per point. Each reading records the reference value (P) and the instrument indication (I).
| Working range | 0 … 500 °C |
|---|---|
| Nominal points | 0 · 125 · 250 · 375 · 500 °C |
| Readings per point | 3 |
| Comparison method | Comparison in a dry-block calibrator with a reference thermometer |
| Decimals | 2 |
| Point 0 °C | P 0.02 · I 0.11 · I − P +0.09 °C |
|---|---|
| Point 125 °C | P 125.04 · I 125.20 · I − P +0.16 °C |
| Point 250 °C | P 250.07 · I 250.30 · I − P +0.23 °C |
| Point 375 °C | P 375.11 · I 375.42 · I − P +0.32 °C |
| Point 500 °C | P 500.14 · I 500.52 · I − P +0.38 °C |
How to read it
At every point the instrument read above the reference, and the difference grows with temperature: from +0.09 °C at 0 °C to +0.38 °C at 500 °C. That pattern suggests a gain (span) error larger than the zero error. The sheet does not pass or fail: compare each difference with the acceptance criterion of your procedure. If there is an adjustment, a new sheet with the condition "after adjustment" records the final result.
Limits and cautions
- The sheet records data: it does not estimate uncertainty, decide conformity or replace a calibration certificate.
- Standard corrections (from its certificate) must be applied by you before recording P.
- Simulating the electrical signal tests the transmitter or indicator, but does not calibrate the complete sensor.
- The draft stays in this browser only; use the backup file to keep or move collections.
Technical basis
Data collection sheet for calibration by comparison with a standard, organized after laboratory practice (ISO/IEC 17025): points over the range, readings and difference per point.
- ISO/IEC 17025 — requirements for testing and calibration laboratories (technical records)
- International Vocabulary of Metrology (VIM) — calibration, adjustment and verification
In the full version, you can
- Set range, points, repetitions, direction and collection identification.
- Record the readings on the device and see means and difference per point.
- Export the blank or filled sheet as an unbranded A4 PDF.
- Keep the draft in the browser, duplicate the setup and save a backup file.
ALOGY Tools subscription
One plan unlocks every subscription tool, with PDF reports and work kept in your account, to open on your phone and computer.
- Every subscription tool, in Portuguese, English and Spanish
- Pix or card on Asaas’s secure page, no boleto
- 7 days to withdraw with a full refund; after that, cancel renewal whenever you want
Frequently asked questions
Is calibrating the same as adjusting?
No. Calibrating is comparing the instrument with a reference and recording the difference. Adjusting is changing the instrument to reduce that difference. That is why the sheet has a condition field: before or after adjustment.
Why is P not equal to the nominal?
The nominal is only the target of the point. P is the value the standard actually showed, with its certificate corrections. The sheet never copies the nominal into P.
Can I use the blank sheet without filling it on the device?
Yes. The field sheet comes out as a PDF with the points and the reading spaces; filling in on the device is optional.